Published on 12/05/2016 | IoT Index
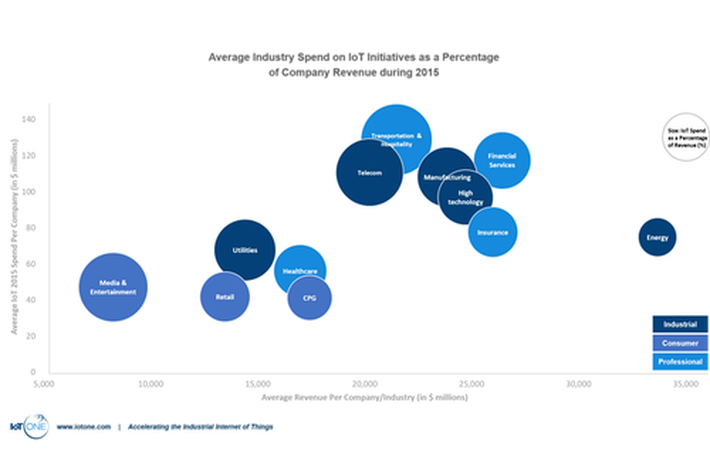
From the bubble chart, we see that cash is flowing into industrial and professional aspect of Internet of Things (IoT) space. For now, industrial use of IoT may look like high spending and high revenue process. However, we believe that for the long run, the revenue that IoT can generate for industrial application will be far more than commercial application. The far reaching impact will shape the way we do businesses and how we utilize resources.
Data source: Tata Consultancy Services